Run it smarter
You get the dashboard, not a summary of it
A great deal of this category runs on keeping the operator slightly in the dark, because a restaurant that cannot see its own numbers cannot check the work and cannot leave. We do the opposite on purpose. You get full access to your own data, all of it, in a dashboard built for someone who runs a restaurant rather than someone who reads reports for a living.
Why this is a real difference
Ask any operator who has used a growth platform what their actual repeat rate is, or which campaign produced which orders, and most of them cannot tell you. They get a monthly summary written by the company being paid to look good in it. That is a choice that platform made, and it is not a technical limitation. Your data is yours. We do not treat showing it to you as a favor.
What you can see
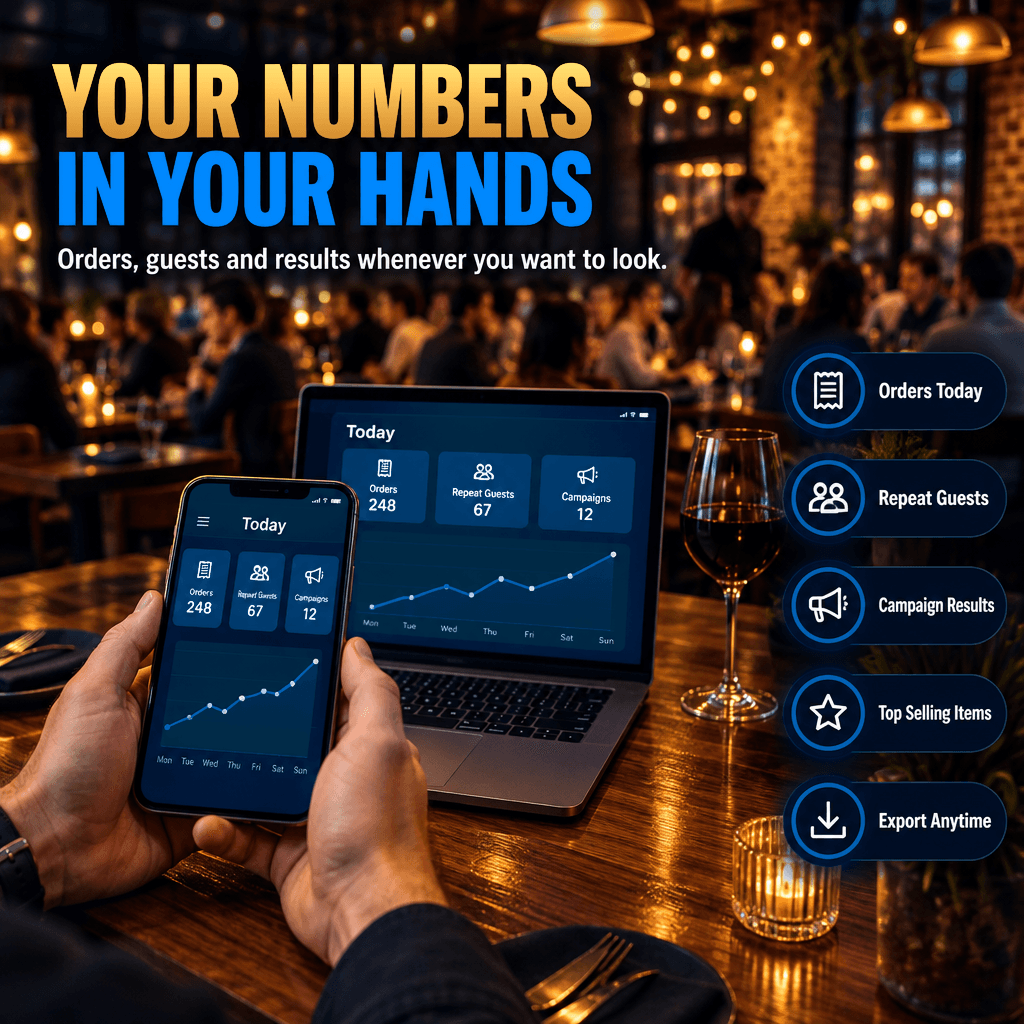
Orders by day, by hour, by channel and by item. Average ticket and how it moves. New guests against returning guests. Repeat rate and how long the gap is between a first and a second order. Which campaign went out, who it reached, what came back from it and what that was worth. Your top items, your fading items, your busiest hours and your dead ones.
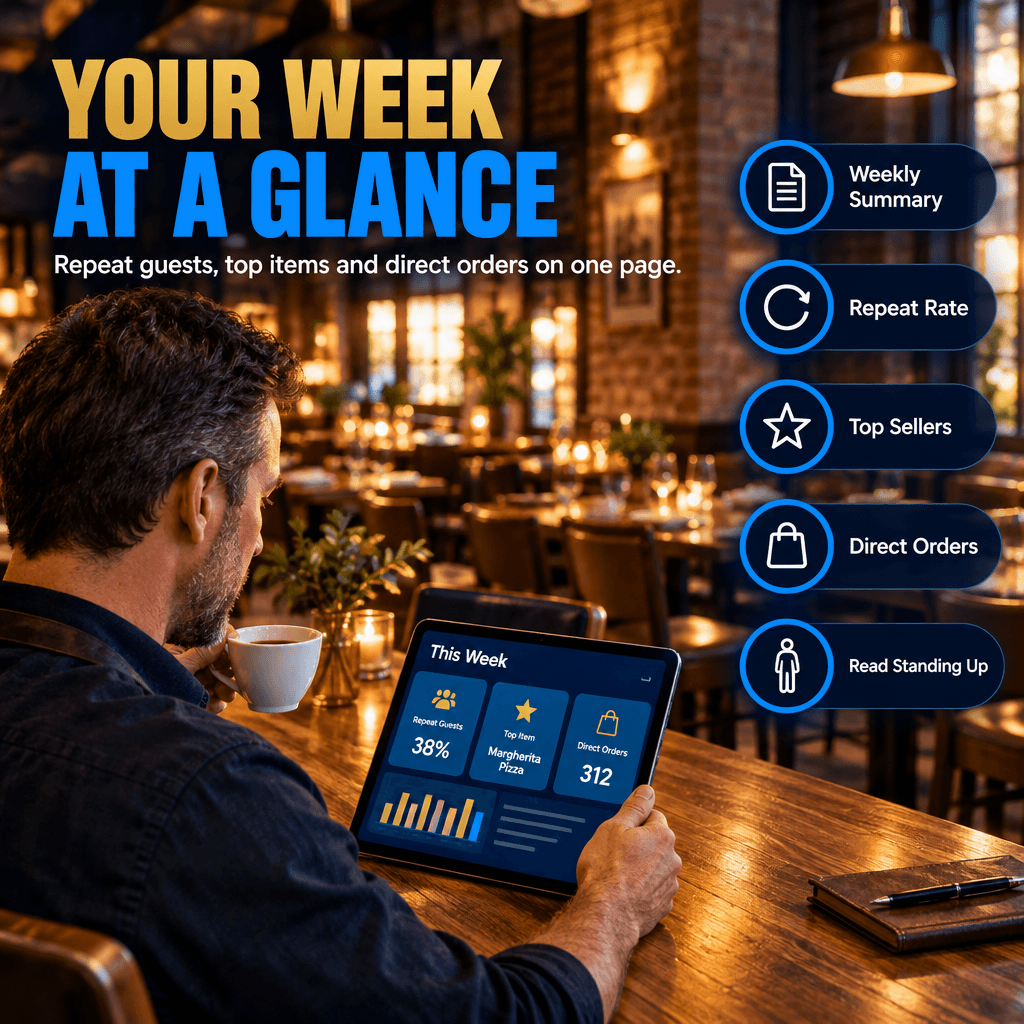
Built to be read while standing up
The first screen answers the four questions an operator actually asks, which are how did yesterday go, how is today going, what is coming back from the marketing, and is anything broken. Everything else is a click deeper for the night you want to sit with it. It works on a phone, because that is where you will look at it most.
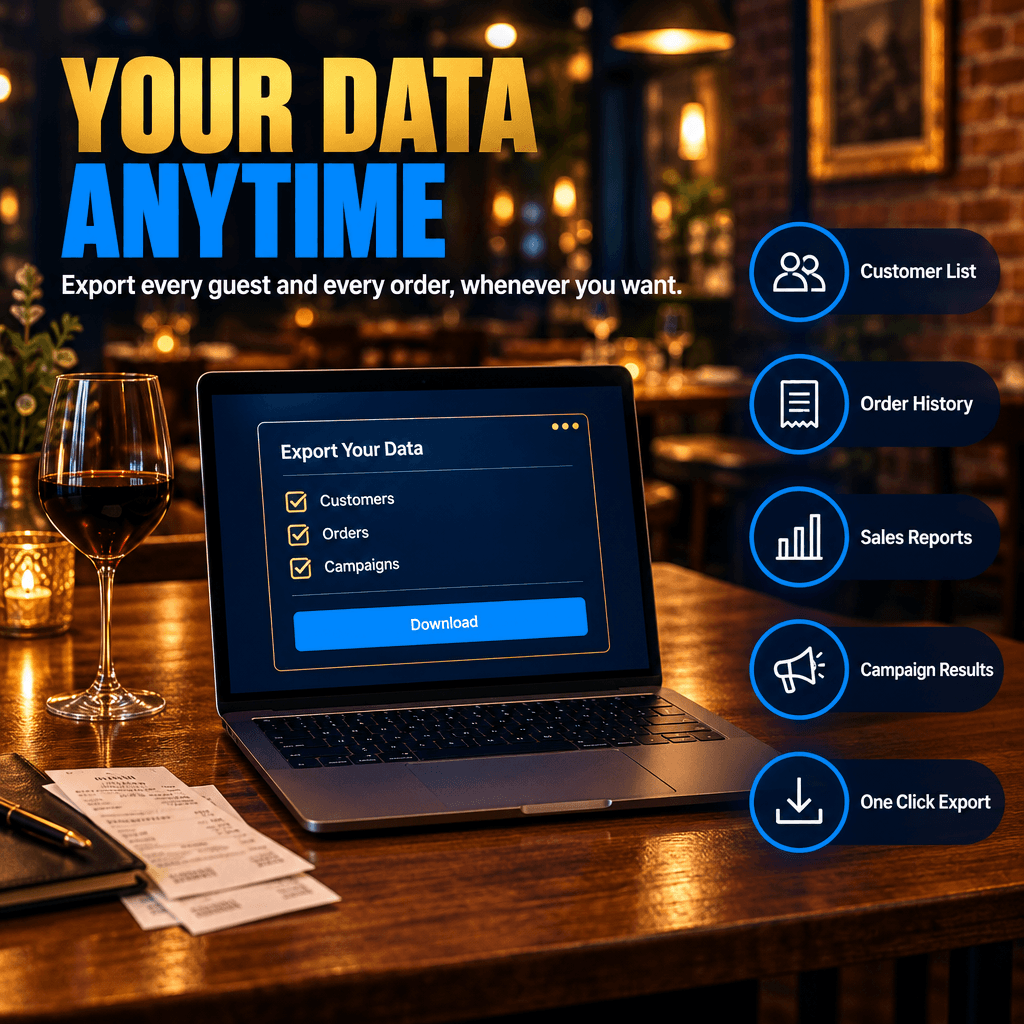
Export anything, any time
Orders, guests, campaign results and financial summaries all export in normal formats you can hand to your accountant or open in a spreadsheet. Nothing is locked in a view you can only look at inside our software.
Switched on
What is actually included in this part
All of it is part of the monthly on both tiers. Nothing in this list is held back for the higher tier.
- A live dashboard in your own account, on desktop and on your phone
- Orders by day, hour, channel and item
- Average ticket, and how it is moving
- New guests against returning guests, and your true repeat rate
- Every campaign, who it reached and what came back from it
- Rewards program participation and what it is producing
- Sales, food cost and labor cost together, where you run the back office
- Multi location roll up with side by side comparison
- Export of orders, guests and campaign results in normal formats
- No summary standing between you and your own numbers
What it changes about your week
At eleven at night you open your phone, see exactly what the restaurant did, see what the last campaign brought back, and know whether the program you are paying for is working. You should never have to take our word for that, and here you do not have to.
Keep going
See what this would look like for your restaurant
A short conversation, your menu, and an honest read on whether this fits what you run. No obligation and nothing owed if the answer is no.